White Paper: Calculate DC Power Efficiency
Data Center Power Distribution and Capacity Planning:
Understanding Power Usage in Your Data Center
Download PDF
About This Series
Raritan, a leading provider of data center equipment, and PTS, a well-respected data center consulting firm and turnkey solutions provider, recently conducted a series of tests to examine the effects of heat, airflow and power usage in a working server environment. The hypothesis was that by knowing more about their real-time operational environment, data center managers would be empowered to manage smarter. Using advanced 3-D computational fluid dynamic (CFD) software and intelligent power distribution units (iPDUs), among other devices, Raritan and PTS were able to monitor temperature and humidity, calculate airflow, as well as measure power for both the IT and supporting infrastructure load throughout Raritan’s and PTS’ server rooms. This series of white papers documents their research and provides you with the key learnings of their tests.
Overview
With the cost of power rising dramatically and increased uncertainty of global power availability, all levels of corporate management are now more focused than ever on managing and conserving energy.
Nowhere is this more critical than in the data center of the corporation, which can consume 25 percent of the total energy in a typical IT intensive organization (Raritan estimate based on U.S. Environmental Protection Agency “Report to Congress on Server and Data Center Energy Efficiency Public Law 109-431”). Due to increased reliance on computing to deliver mission-critical applications and the emergence of blade technology and virtualization, server density is dramatically increasing.
These increases mean that data centers are running hotter and HVAC systems are working overtime to keep the center cool. This, in turn, is driving energy costs up — a growing concern for IT, given the potential for this expense to become an above-the-line IT charge.
Clearly, there’s a need to monitor data center power and temperatures — and adjust heating, cooling and airflow — to minimize power consumption while maintaining IT equipment uptime. But where should forward-thinking corporations start? What tools are available to get the data needed to design a more efficient data center?
This white paper, the first in a series, takes a look at some of these thorny energy management issues and provides some relevant answers. You’ll learn the following three things:
- The flaws in what you thought you knew about power measurement
- What kind of measurement instrumentation you need to calculate your data center’s power efficiency
- How to set standards that bring your data center in alignment with Green Grid
The Challenge
When energy management was a low priority, IT managers could rely on simple calculations associated with nameplate specifications to predict overall power usage in their data centers.
However, average data center power consumption has grown from 2.1 kilowatts per rack in 1992 to 14 kw/rack in 2006, according to HP (“HP Power & Cooling,” August 31, 2006). Simply multiplying the number of servers by their nameplate ratings does not jibe with the reality of actual energy consumption statistics. DatacenterDynamics, in their Spring 2007 Conference Survey, found that the average power density among all respondents in the U.S. was 5.5 kw/rack and the average maximum power density was 11.6 kw/rack.
Moreover, many industry analysts such as Gartner (“25th Annual Data Center Conference,” December 2006) have been predicting significant power shortfalls for more than a year now. While some companies have flexibility to move their data centers to locations that provide more reliable, less expensive power, most simply cannot. Which means that shortfalls, left unresolved, could force IT and facilities managers to make hard decisions about which applications to support and which ones to sacrifice to keep the business running during peak demand.
As energy issues come under more scrutiny and as tools become available for accurate measurement, IT administrators and facilities managers should no longer rely on the published nameplate power ratings on their units and factor in accepted industry assumptions. While adequate in the past, “close enough” isn’t “good enough,” given the potential power crisis that’s just over the horizon.
Only through individual server measurement can managers accurately know what power their equipment is drawing and acquire precise numbers that will aid their energy efficiency planning efforts.
With the knowledge gained regarding server-by-server real-time monitoring, IT administrators can manage smarter and feel secure that they are making better decisions on what to power off because they will be able to:
- Identify non-working processing assets
- Identify low-efficiency processing assets (e.g., lots of power draw for little computational power)
- Assist capacity planning against the design rating for all power protection, distribution and cooling infrastructure equipment
Nameplate Ratings and Assumptions
Server manufacturers indicate a power rating value on the nameplate of every server. Data center administrators, however, know that this represents a worst-case scenario, and typical server power consumption never reaches the rated nameplate value. One easy way to increase server density is to simply derate the nameplate power by a certain percentage — depending on the workload that’s deployed on the server.
PTS refers to this derated value as the design rating of the equipment. It is typically 50–75 percent of the nameplate rating, and is used to size all power protection, distribution and cooling systems in the data center. This percentage is still frequently higher than what is seen in actual use, but now more accurate, real-world numbers can be obtained through the use of intelligent PDUs.
For example, by measuring power consumption of individual servers using intelligent PDUs, PTS’ analysis of Raritan’s IT equipment determined that consumption typically ranged from 20–85 percent of the underlying equipments’ nameplate rating, averaging about 31 percent — far less than the numbers typically used as the design rating of the equipment.
IT Equipment Power Load vs. Total Facility Power Load
Another important measurement to get a handle on is the power drawn by IT equipment in relation to the total power consumed by the facility. APC-MGE estimates that 30 percent of total power usage in a data center represents the load placed on power grids by servers and other IT equipment, while 70 percent is for everything else — cooling, air movement, power distribution, lighting, etc. EYP Mission Critical Facilities, a division of HP, puts these numbers at 50 percent and 50 percent.
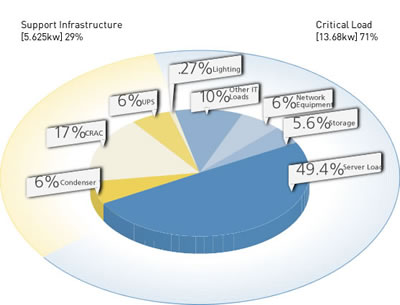
A preliminary observation by PTS and Raritan, however, found that 71 percent of the energy consumed was for the critical IT load, with only 29 percent spent for the support systems. This high percent of power going to the critical IT load is an indication that PTS and Raritan are doing a better job managing power in their data centers than is typical in the industry. It also points to an opportunity to press loading factors … doing more computing with less energy.
These numbers illustrate the importance of getting accurate measurements in your data center rather than relying on “industry averages.”
Measurement Systems
So how can you arrive at these measurements, efficiently and accurately? The following are some overall pieces of the puzzle to consider:
Branch Circuit Monitors and Individual Device Load Measurement
Branch circuit monitors are electrical devices that measure current load on all circuits on an electrical panel and alert operators when the load approaches the breaker’s rating. This is especially important in data centers, for example, where additional servers can get plugged into a circuit that’s already approaching its capacity. Branch circuit monitors continuously measure the current on all circuits and ensure that someone is notified before a circuit breaker reaches its rated capacity, or worse, trips
Data Center Environmental Aggregators
Environmental aggregators are specifically designed to gather relevant power and environmental data center information. They can also consolidate the collected information and analyze it to help you make informed decisions related to power consumption by both IT and facilities equipment.
Intelligent PDUs
Intelligent rack PDUs provide IT staff the ability to monitor the power consumption of any given server, storage unit or other IT device, which is helpful to identify those that are underutilized or identify those that are approaching or exceeding their normal high range of usage. There is also the ability to monitor and control the data center power load at the facility level.
Intelligent rack PDUs can be controlled remotely via a Web browser or command line interface (CLI). They can meter power at both the PDU level and the individual outlet level; support alerts based on user-defined thresholds; provide security in the form of passwords, authentication, authorization and encryption and incorporate rich environmental management capabilities. Some models are also highly customizable, support the industry’s latest standards-based techniques like SNMP TRAPs/SETs/GETs, IPMI, SMASH CLP and integrate seamlessly to existing corporate infrastructures like LDAP, Active Directory®, RADIUS and NFS servers.
Still, these tools cannot reach their full potential if the modeling is based on just a static environment. In the real world, data centers are dynamic. Server utilization changes over time, which causes power consumption and heat generation/dissipation to change. This, in turn, requires appropriate cooling to specific racks or rows of computers.
So the next step is to determine your data center’s power usage effectiveness rating.
The Green Grid: Calculating PUE
The Green Grid defines Power Usage Effectiveness (PUE) with this formula:

“Total facility power” in this equation is the power required to operate the entire data center, including servers, IT equipment, lighting, cooling, air movement, etc. “IT equipment power” represents the power required to operate the servers and IT equipment alone.
PUE can range from 1.0 to infinity. A PUE value approaching 1.0 would indicate 100 percent efficiency (i.e., all the power is used by IT equipment only). Currently, there are no comprehensive data sets that show the true spread of the PUE for data centers. Some preliminary work by PTS indicates that many data centers may have a PUE of 3.0 or greater, but with proper design a PUE value of 1.6 should be achievable.
Tools to Calculate PUE
You must accurately measure power usage when calculating your PUE to establish a baseline and to measure your improvements. Raritan and PTS designed and implemented the following measurement strategy to accomplish this:
A Veris H8820 data acquisition device was deployed to measure branch circuit amperage for each load, and calculated power feeding the computer room air conditioning (CRAC) units, lighting, UPS and other non-IT loads. This unit was selected since it was easy to deploy and provided the data required.
Geist Racsense environmental monitors were deployed with temperature probes at the top and bottom of each rack (front and back), as well as the supply and return of each CRAC unit. One humidity probe was also deployed to measure the humidity of the room. The Racsense devices provided efficient installation and cabling and simple data collection.
Two Dominion® PX intelligent power distribution units were deployed in each rack. This enabled capture of the active power of the critical IT loads at a per device level. This detailed critical IT load data provides the granularity of information required to measure the PUE and make recommendations on how to improve it.
The Results
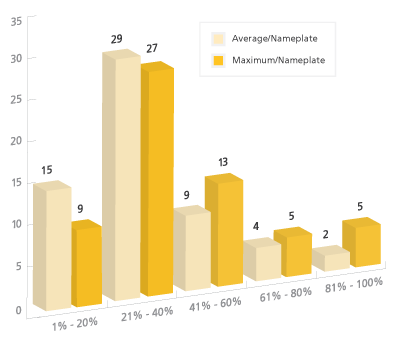
Variability in server power consumption relative to nameplate rating
Nameplate Vs. Actual Power Draw
The histogram to the right shows the frequency distribution of actual power consumed as a percentage of the nameplate values (capacity), based on readings in the Raritan data center taken from February 21 through February 26, 2008. The nameplate value indicates the maximum amount of power a device can use at any given time under any kind of workload and data center environmental condition.
Current data center design rules use the nameplate value to perform capacity planning. Using this method for data center design leads to inefficiency due to overcapacity since the nameplate value is a maximum value. Derating this value by a fixed percentage reduces some of the inefficiency, but our chart below indicates that actual power consumed in operations has such a wide range that it makes it difficult to select a derating factor that balances efficiency and ensures reliable operation.
For example, measuring average active power, 29 devices in Raritan’s server room consumed between 21%–40% of this capacity, while 15 consumed a higher percentage of capacity and 15 devices consumed a lower percentage of capacity. While measuring maximum power, 27 devices in our server room consumed between 21%–40% of this capacity, while 23 consumed a higher percentage of capacity and 9 devices consumed a lower percentage of capacity.
The main observation is that the actual power capacity consumed has a wide potential range. This means that using derated nameplate values either leaves room for being more efficient or puts reliability at risk. A derated design is the first step, but actually measuring the power a device consumes in live operations provides you with the additional information needed to be more efficient and ensure reliable operations.
Calculating Raritan’s PUE
As the chart to the right shows, approximately 71 percent of the total average power consumption was used for Raritan’s critical IT equipment — 49.4 percent for servers alone — while the remaining 29 percent was for support services like cooling and lighting.
To calculate Raritan’s PUE based on the previous formula:
Total Power = Support Infrastructure (5.625kw) + Critical Load (13.68kw) = 19.3kw
Total IT Equipment Power = Critical Load (13.68kw)

Raritan’s PUE = 1.4
Conclusions
Rising energy costs and diminishing supplies were primary motivations for this survey. So over a five-month period, Raritan and PTS defined and implemented a plan to instrument
Raritan’s server room and measure the power usage at an IT device level and at a branch circuit level for non-IT load. Based on that survey, Raritan discovered the following:
- Assuming at the outset that their server room had a poor PUE value, Raritan instead learned that it had a respectable PUE value of 1.4, and a total average power load for their IT equipment of 10.5kw (servers and storage combined).
- Implications of this is that armed with this knowledge, Raritan can take a smart approach to managing and provisioning their data center:
- Raritan does not have to add servers to add computational power
- 44 devices registered an average active power consumption equivalent to the draw of an idle server. This provided a good indication that they could save energy by consolidating those near-idle servers. Assuming a typical consolidation of 10 to 1, they could potentially decommission about 40 devices.
- Raritan can avoid a mission-critical disruption by deploying better load management
- Two devices were running at between 80–100 percent of rated power capacity. If Raritan was using the industry average derating figure of 60–80 percent, this could have posed a potential problem with regard to server performance.
- The same two devices were investigated to make sure that they were not creating hot spots or drawing power too close to power circuit capacity limits and therefore presenting a potential for problems.
- Raritan can reduce its OpEx expense without putting required computing at risk.
- Using intelligent rack PDUs gave Raritan the actual power consumption at an individual IT device level, providing the data needed to plan the next steps to become more efficient.
The measurement activity also provided a number of unforeseen benefits beyond providing data to make a PUE calculation. A sudden drop in energy usage, for example, led the IT staff to discover that a circuit breaker on one of their CRAC units had tripped. This prompted a repair before hot summer weather arrived and presented a cooling problem. A temperature sensor located high in a rack alerted them to the fact that a rack fan had failed.
Since industry benchmarks are based upon a broad range of averages, and each data center has its own unique attributes that cause it to deviate from the averages, this Raritan and PTS survey validated Green Grid’s position:
“In order to improve the energy efficiency of data centers, it is first necessary to measure the energy consumption of the entire data center and each of its constituent subsystems.”
What’s Next?
In the next white paper, we will examine the use and advantages of Computational Fluid Dynamics to help make your data center more energy efficient. We’ll also compare and contrast our CFD results when using actual measurements vs. nameplate data.
About PTS
Founded in 1998, PTS is a turnkey solutions provider specializing in data center and computer room consulting, engineering, infrastructure, construction, and maintenance services. They offer a broad range of project experience in designing data centers, computer rooms, and technical spaces. They employ industry best practices in integrating proven, ‘best-of-breed’, critical infrastructure technologies that result in always available, scalable, redundant, fault-tolerant, manageable, and maintainable mission-critical environments.
From their corporate headquarters in Franklin Lakes, New Jersey, and their branch office in Orange County, California, PTS works to fulfill their mission of creating satisfied customers by emphasizing pre-design and planning services to provide the optimal solution to meet its clients’ needs and resulting in an early and accurate alignment between scope, schedule and budget.
For more information, please call 1.866.PTSDCS1 / 1.866.787.3271 / info@ptsdcs.com.
About Raritan
Raritan, a brand of Legrand, is a trusted provider of rack power distribution units, branch circuit monitors, transfer switches, environmental sensors, KVM-over-IP switches, serial console servers, and A/V solutions for data centers and IT professionals. Established in 1985 and based in Somerset, N.J., Raritan has offices worldwide serving customers in 76 countries. In more than 50,000 locations, Raritan’s award-winning hardware solutions help small, midsize, enterprise, and colocation data centers to increase efficiency, improve reliability, and raise productivity. And provide IT departments with secure, reliable remote access tools needed to manage mission-critical environments. For more information, visit us at Raritan.com.
Download PDF