White Paper: Environmental DC Management
Environmental Data Center Management and Monitoring
Download PDF
Introduction
Managing mission-critical facilities can be challenging, especially as data center power and cooling needs continue to increase to support new business applications. To meet these demands, you need the right solutions to measure and manage environmental risk factors impacting your operation’s uptime, availability, and cost.
Not long ago, data center managers once thought that environmental management and monitoring were accomplished by simply placing some temperature sensors and perhaps some humidity sensors in different areas around the data center. A thermostat was then used to indicate the room’s ambient temperature and would generally be set to 60˚F (16˚C) to ensure adequate cooling. Today, most data center managers know that such an ambient temperature is unnecessarily cold and a waste of energy. They also know that seeing plots of temperatures from multiple sensors placed in targeted areas is much more impactful in identifying hot spots and specific regions of overcooling.
Though temperature and humidity sensors remain the most prevalent sensors used, many other sensors can also be deployed usefully in a data center, including sensors for:
- determining whether a cabinet door is open or closed,
- measuring the difference in air pressure between two locations,
- monitoring the rate of airflow,
- measuring dust/particle levels,
- detecting shock and vibrations over a range of frequencies,
- as well as detecting the presence of water.
This white paper reviews how these sensors, when properly deployed and managed, can help you maintain an optimum environment to operate your data center efficiently.
Sensor Design Considerations
Architecture
Sensors can be deployed as a separate overlay network or as part of an existing network. Deploying sensors as an autonomous overlay network requires a sensor management solution with an intelligent controller, such as the Raritan Smart Rack Controller (SRC), with its own network connections. In data centers where non-intelligence rack power distribution units (PDUs) are deployed, this would be the most effective option to instrument sensors throughout a data center.
When sensors are deployed as plug-and-play options to intelligent rack power distribution units (PDUs), such as with Legrand’s Raritan and Server Technology Rack PDUs, there is no need for a separate overlay network. Since the PDU already has one, it helps in reducing costs.
The deployed sensors communicate the data collected to energy management software via an Ethernet network. A Web-based GUI connected to your intelligent rack PDU or intelligent sensor management solution will also report and plot sensor values in real-time or over time, giving you valuable insights about your data center.
Sensor Design & Form Factor
There are analog and digital sensors. One isn’t necessarily better than the other; it depends on the application and the nature of the deployment. Analog sensors tend to be smaller and, therefore, more easily deployed. Digital sensors can be more accurate but are often physically larger, making some deployments more challenging.
The form factor of a sensor can have some implications for its application. For example, temperature sensors at the IT devices’ cool air inlets require small sensors that can be easily and unobtrusively mounted to the front of a rack.
Sensor Placement
Sensor placement is a matter of understanding the purpose of the sensor and the use of the resulting data you will receive, both within the context of industry standards and the wisdom of best practices. Temperature and humidity sensors, for example, should be deployed in larger quantities and various locations—since understanding the efficiency of your mechanical system is a big-picture exercise. Water/leak-detection sensors, on the other hand, should be deployed in a more targeted manner.
Almost by definition, best practices are ever evolving. As new monitoring challenges arise and sensor technologies are made available, the location and use of sensors at the rack and within the data center will continue to evolve. Industry guidelines written by the American Society of Heating, Refrigerating and Air-Conditioning Engineers (ASHRAE), Telcordia Network Equipment Building System, the Department of Energy Data Centre Energy Productivity, European Telecommunication Standards Institute, and EU Code of Conduct, as examples, to help guide you on local and national regulations.
Here is a short list of data center sensor types and suggested placement locations:
- Temperature and Humidity sensors — measure degrees and RH. Per ASHRAE guidelines, position at three locations in front of and at the back of the rack to capture Delta T.
- Contact closure sensors — provide an alert when contact across adjoining surfaces is no longer maintained. Mainly used on rack door entrances can also be used to monitor critical electrical and control panels.
- Air pressure sensors — measure pressure differential above and below the raised floor, for example. Best located in targeted areas, one above and one below a particular location.
- Airflow sensors — measure the air movement in meters/second. Best located at perforated panels, minimum of one per aisle; also, at supply and returns of CRACs (computer room air conditioner) units or CRAHs (computer room air handling) units.
- Dust/particle sensors — measure airborne particles and dust deposits. Best located throughout the white space near IT equipment is located in the direction of airflow through cabinets.
- Shock/vibration sensors — detect shock and vibrations in three (3) mutually perpendicular directions. Most are used in cabinets or directly on IT equipment.
- Water/leak-detection sensors — provide alerts when continuity is no longer maintained along a rope or at a sensor due to contact with liquid — commonly located around CRACs, along the route of refrigerant piping, or building water utility lines.
Temperature and Humidity Sensor Placements
Every watt of power consumed by IT equipment converts into a watt of heat. As the power consumed at the rack has dramatically increased due to high-density racks, so has the heat generated by IT equipment. Accurate placement of temperature sensors on a rack means temperatures can be monitored to ensure that IT devices do not overheat and that energy is not wasted by overcooling. Tracking data collected from individual sensors allows you to identify hot spots requiring additional cooling or changes in the airflow or air pressure of the system to ensure adequate cooling reaches all locations where it is needed.
ASHRAE is one of the most important organizations for data centers regarding heating and cooling and specifically recommends rack positions for temperature and humidity sensors. The ASHRAE Thermal Guidelines for Data Processing Environments recommend establishing temperature and humidity measurement locations in each aisle with equipment air inlets. It states that standard temperature and humidity sensors mounted on walls and columns are not deemed adequate for this testing. The guidelines recommend establishing locations for measuring aisle ambient temperature and humidity, where points are permanently marked on the floor for consistency and ease in the repetition of measurements, including,
- Establishing at least one measuring point for every 10-30 ft (3-9 m) of an aisle or every fourth rack position.
- Locating points midway along the aisle, centered between equipment rows.
- Where hot/cold aisle configurations are employed, only establishing measuring points in cold aisles.
The guidelines state that measurement points picked should be representative of the ambient temperature and humidity and to measure aisle — temperature 4.9 ft (1.5 m) above the floor, which can be helpful in some equipment configurations depending on the cabinet type or rack used near the measuring area.
Every 4th cabinet or 3 to 9 m (10 to 30 ft) of aisle.
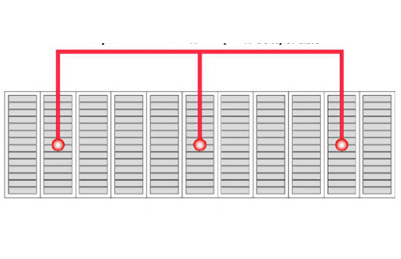
Measurement points in aisle.
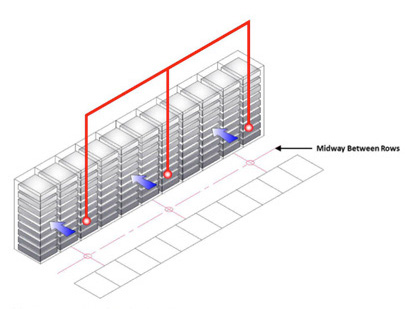
Measurement points between rows.
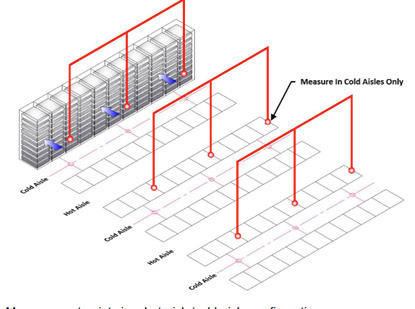
Measurement points in a hot-aisle/cold-aisle configuration.
ASHRAE’s Aisle Measurement Location Guidelines
ASHRAE also publishes recommended ranges for temperature (65˚F to 80˚F, 18˚C to 27˚C) and relative humidity (20% to 80%). The upper end of the ASHRAE temperature range, 80˚F, is approximately the point at which an IT device’s fan turns on. Since both cooling infrastructure and internal fans consume power, the most efficient way to operate a data center is for the cool air at the device air inlet to be close to 80˚F.
One of the best ways to understand the relationship between temperature and humidity is to look at a psychrometric chart. At the bottom of the chart is dry bulb temperature meaning air containing no moisture. The scale on the right of the chart is the amount of moisture in pounds contained in a pound of dry air. The curves running through the chart are the relative humidity (RH) from 0% to 100%. The temperature scale along the 100% RH curve is the wet-bulb temperature. 100% RH is the maximum amount of moisture the air can contain. Beyond this point of reference, the dew point (DP), the excess moisture condenses into droplets. The chart’s height increases from left to right because colder air can hold less moisture than warmer air.
Environmental envelopes pertaining to air entering the IT equipment

Psychrometric Chart of ASHRAE Recommended and Allowable Environmental Envelopes
Source: ASHRAE Thermal Guidelines for Data Processing Environments
Data centers using airside economizers need to think about adding humidification because of the cool outside air. Let’s assume 40˚F (4˚C) and 50% RH which is approximately 0.003 pounds of moisture — comes into the data center and is then warmed by IT equipment to approximately 80˚F (27˚C). 0.003 pounds of moisture at 80˚F is less than 15% RH below the ASHRAE recommendation of at least 20% RH to minimize electrostatic discharge.
Suppose you fill a glass with ice water on a warm summer day, condensation forms. This is because the air at the surface of the glass has cooled from say 75˚F (24˚C) down to just above freezing at the surface of the glass. If the 75˚F air had a RH of 50% that would be 0.019 pounds of moisture per pound of air. But, at 32˚F (0˚C) air saturates (100% RH) at 0.004 pounds of moisture per pound of air. The excess moisture (0.019 – 0.004) becomes condensation on the glass.
Airflow Sensor
Data center airflow management planning is the process of clearing paths for hot and cold air, including monitoring the temperatures in these locations. A primary concern is preventing the hot and cold air from mixing, being stranded by obstructions, or bypassing the IT equipment.
If your data center uses a raised floor configuration, the area under a raised floor is often used as a plenum for chilled air. However, this space can become cluttered with networking and power cables which can restrict the cooling airflow. When new power or network cables are run under the floor, old cables are often left in place. Over time these obstructions build up and can seriously restrict airflow.
Perforated tiles allow the chilled air from the raised floor plenum to flow up to cool IT devices. Obstructions can block this airflow within the plenum, and perforated tiles are available with various size holes. A cooling problem might be solved by changing to a tile with larger or smaller holes. It is crucial to monitor the chilled airflow, but it can also be essential to monitor the hot air return airflow.
If your data center does not use a raised floor configuration, as has become the design standard, there are entirely different airflow patterns to measure. Instead of moving air in underfloor pathways up through an open floor tile in front of a rack, you are now blowing air down the cold aisle in front of all racks. As the air moves down the cold aisle, it reduces in velocity as it gets to the end. Thus, pressure fluctuates down the row, making it difficult to establish a good pressure measurement point. Using properly placed temperature sensors allows data center managers to better measure proper airflow in a non-raised floor data center to the rack, increasing system efficiency. The ability to set thresholds and alerts when deviations occur allows you to maintain SLAs better and reduce energy waste.Differential Air Pressure Sensor
In fluid dynamics, Bernoulli’s principle states that for a fluid flow, an increase in the speed of the fluid coincides with a decrease in pressure or a reduction or a decrease in the fluid’s potential energy. If you think about a shower curtain, it hangs straight down before the shower is turned on. But when you turn on the shower, the fluid inside the shower (air, steam, and water) is moving faster than the fluid outside the shower (air), so the shower curtain is drawn into the shower because of the pressure inside the shower has decreased.
For hot aisle/cold aisle deployments using variable speed fans to conserve energy is the difference in the flow of air between the two aisles that can cause fewer rigid partitions, like plastic curtains being drawn into one of the aisles creating air leaks. A differential air pressure sensor set up to alert when thresholds are crossed can help identify if there are pressure differences that might lead to partition leaks and inefficiencies.
A chimney above a high-density / high-heat rack, and therefore high air pressure in the restricted volume of a chimney, might leak hot air into a neighboring chimney above a low-density / low-heat rack and consequently low pressure. A differential air pressure sensor can indicate if such a condition exists.
Dust/Particle Sensor
Airborne particle and dust deposits — such as organic dust, concrete dust, ferrous metal particles, electrostatic dust, and haze due to forest fires, as examples — are an invisible threat to data centers, server rooms, and other areas where IT equipment is installed. Although not naturally harmful to IT equipment, these ultrafine particles may build up over time, interfere with a device’s normal functioning levels, and even lead to its short circuit.
Industry guidelines, such as ASHRAE TC9 and the International Organization for Standardization’s ISO 14644, outline air cleanliness measures to help ensure the air quality around such equipment is maintained at optimal levels to prevent overheating. When deployed, a dust/particle sensor will monitor particle levels flowing through it and help identify if levels are above or below custom thresholds set.
Vibration Sensor
It is also recommended to ensure that your sensor installation protects equipment from excessive vibration and shock.
In instances where different types of servers are installed in the same cabinet or rack, take note of product specifications one server’s overall vibration and shock characteristics may exceed those of the server with the lowest vibration and shock specifications. As an example, if you install two different types of servers in the same cabinet, and one server tolerates 5g peak shock and the other server tolerates 12g of force at its peak shock, it is recommended to ensure that the vibration of the cabinet does not exceed the 5g of force at its peak shock.
Seismic activity could be a serious concern depending on your data center location. Look for sensors that can detect vibrations, such as earthquakes or damaged fans, along three axes (x, y, z).
Contact Closure
Contact closure sensors can be set to be normally open or normally closed. They are often connected to third-party sensors and send an alert when the third-party sensor is triggered. For example, a contact closure sensor could be connected to a third-party smoke detection sensor and send a signal when smoke is detected.
From a security perspective, many organizations are deploying contact closure sensors to alert security personnel in case of unauthorized access to the cabinet. Some solutions will also activate a camera system pointing to the distinct rack that has been accessed. Furthermore, you can even deploy proximity sensors alongside contact closure sensors to capture when someone passes nearby a cabinet.
Water Sensor
Water sensors can be used under racks to detect leaks; there are individual “rope” or “cable” sensors. A rope sensor can be laid under a row of racks and detect water anywhere along its length. A rope sensor can also be wrapped around pipes to detect leaks.
Depending on your data center environment, it is recommended to place water/leak sensors around the outside walls of the room and beneath the raised floor. Place water sensors around the unit to monitor water and coolant leaks to detect wetness from cooling units. Take extra precautions if you have liquid-cooled systems.
Webcam
A webcam can be considered a sensor because it monitors a data center by providing images. These can be still images mentioned in the example above in the contact closure section or video can be streamed, such as in a surveillance application.
Management Software
All these data points provided by sensors need to be managed. Environmental sensors can play an essential role in partial or complete data center infrastructure management (DCIM) solutions. Sensors can provide vital inputs for establishing a baseline of initial conditions, identifying problem areas such as hot spots or water leaks, and tracking and reporting improvements and savings. For example, a corporate social responsibility (CSR) report can add trends of increasing data center temperatures over time to the information on reduced cooling energy consumption—confirming that proper operating conditions have been maintained.
Sensors are advantageous as part of a capacity planning process, helping to answer if you have adequate cooling where it is needed. As described earlier, energy management software that can plot temperature sensor data on a psychrometric chart gives data center managers a view of what is happening. Are some racks in hot spots? Do some areas of the data center require humidification? Careful planning is needed when changing cooling infrastructure. There can be unintuitive consequences. For example, adding additional air conditioning units might worsen existing hot spots or create new ones if the units disrupt airflow patterns.
Thresholds and Alerts
One of the many benefits of sensors is setting thresholds and alerts to receive notifications when environmental conditions are at risk. Signals on the sensor that can be synchronized and communicated to you remotely improve the response time to remediate critical risks. For example, a temperature sensor can send an alert if the temperature rises to a level that might damage sensitive IT equipment. It can also be set to send an alert if the temperature falls below a threshold to ensure that energy isn’t being wasted by overcooling the data center.
It may even be necessary to set different thresholds for different locations. For example, the sensor thresholds on the cool air inlet side would be lower than on the hot air exhaust side.
In general, higher levels of accuracy are preferred, but the importance of accuracy varies depending on what is being metered and monitored. For example, energy usage, measured in kWh, should be accurate to +/-1% to support billing or reporting.
For humidity, accuracy is less critical, though you should ensure that relative humidity (RH) guidelines are followed.
The Benefits of New Technology, Solutions, and Tools
A data center, whether a room or an entire building, is all about what is happening at the rack. The right environment monitoring and metering at the rack can lead to some nifty improvements – right-sizing the data center and just-in-time expansions to save on capital expenses; improved energy efficiency, IT productivity, and utility; and better integration with cloud computing.
The right way to look at a data center is not as several different IT devices and supporting infrastructures, but instead look at the data center as a system. Each of the components has an impact on the other components.
For example, replacing 1U “pizza box” servers with blade servers can significantly increase the amount of power consumed and the amount of heat that must be removed from a rack. Bringing in DCIM software data points from several different types of sensors lets data center managers see their total operation as a whole yet with the ability to drill deeper into specific details. An environmental management and monitoring program using one or more of the sensors described in this white paper is a good step toward understanding a data center. Use technology, solutions, and tools to make intelligent use of all your IT resources, including IT assets, power, cooling, networks, and, of course, people.
Sensor Selection Criteria
In closing, we recommend considering these five essential factors when selecting sensors for your data center:
- Look for scalable solutions. Your data center is an ever-evolving part of your business. It is paramount to note when refreshments are typically planned or when evolution forces you to make changes. These changes require more intelligence around data center management and the ability to scale. As you deploy more racks, you will have more servers and likely start looking at edge deployments. Sensors that can scale on demand and integration with management frameworks will help give you real-time insights and help your business increase its agility. A suitable sensor and environmental monitoring platform should not introduce complexity or fragmentation. Instead, they will integrate into your overall management platform to give you visibility and granular control.
- Look for high metering accuracy. You need to deploy sensors that are proven and accurate. For example, Legrand’s data center SmartSensors deliver high metering accuracy at +/-2°C for temperature sensors and +/-5% for relative humidity. Accurate environmental data leads to fewer false-positive alerts and easier overall data center management.
- Look for sensors that are easy to install, upgrade, and repair. Suppose sensors have removable sensor heads or are designed with dual RJ-45 connectors. In that case, it will ease the installation and servicing of sensor packages without having to rewire the rack, saving time and maintenance costs.
- You might need to cascade and increase your sensor package deployment in some situations. To increase the number of connected sensor packages per sensor port, you need to look for sensor solutions that can be easily cascaded using standard network patch cables. And that cascading can go high. For example, Legrand’s SmartSensors cascade up to 32 sensor packages in a row, linked with standard Cat5/6 cables.
- Integration with DCIM to help spot trends and more. It would help if you considered looking for environment sensors that are used alongside a DCIM analytic solution to allow you to monitor temperature trends in real-time, calculate potential savings, and generate reports to share with end-users and management. From there, these solutions help optimize your data center ecosystem to ensure that you meet guidelines and setpoints, reduce operational costs, and improve your power usage effectiveness (PUE).
©2022 Legrand. All rights reserved. The industry-leading brands of Approved Networks, Ortronics, Raritan, Server Technology, and Starline empower Legrand’s Data, Power & Control to produce innovative solutions for data centers, building networks, and facility infrastructures. Our division designs, manufactures, and markets world-class products for a more productive and sustainable future. The exceptional reliability of our technologies results from decades of proven performance and a dedication to research and development.
Download PDF