OUTPACE.
OUTTHINK.
OUTPERFORM.
The Industry's Most Intelligent Solutions
We build the most innovative rack PDUs and the most secure and reliable KVM and Serial Access Devices.
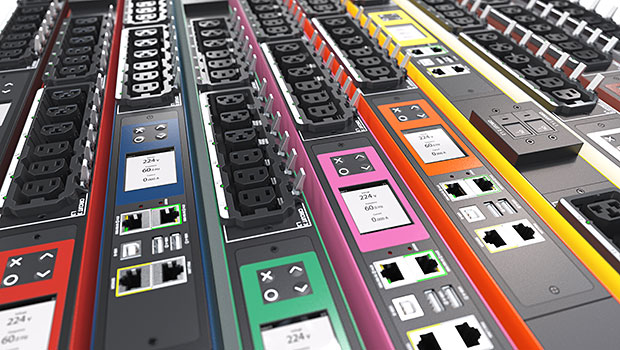
Rack Power Distribution Units
1000+ models with individual outlet switching, metering, and 400V power distribution. Designed with intelligence, high density outlet technology, and advanced Power Quality Metrics that ensure a reliable infrastructure.
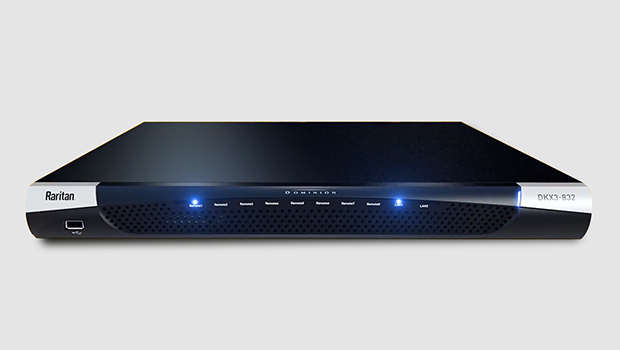
KVM and Serial Switches
High performance, reliable, secure, and java-free. When your remote access solution must work, redundant NICs and power supplies provide peace of mind.
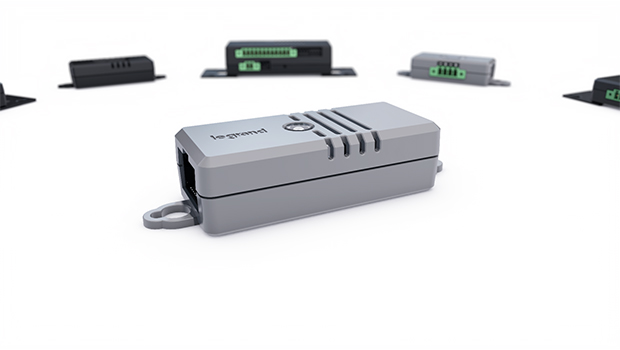
SmartSensors
Engineered to help monitor and maintain your rack environment, identify hot spots, ensure security, and receive real-time alerts to prevent downtime.
Latest News, Products, and Announcements
Data center managers are continuously faced with providing increased power levels in progressively reduced areas. Learn how our products provide a solution.
.jpg)
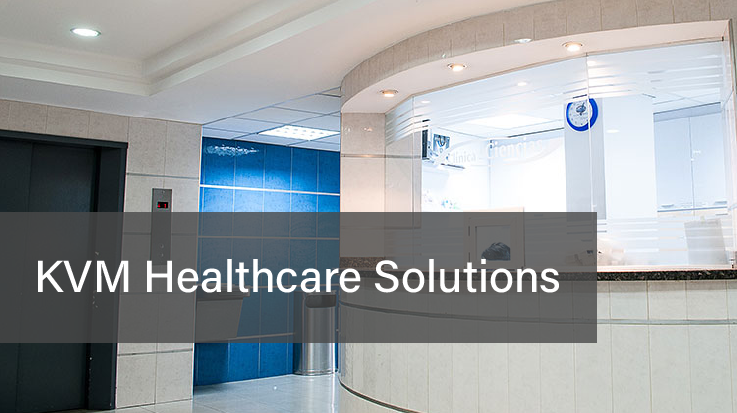
KVM over IP enables secure, remote management of healthcare IT and telemedicine solutions, ensuring compliance and efficiency.
Discover the latest industry insights and expert advice on data center management by reading our blog!

Connect with us and stay up to date with the latest from Raritan on LinkedIn

What Makes Us Different?

Years
30 Years of Data Center
Expertise

Billion
Proven with
1.5 Billion Hours of Runtime

Top 10
Trusted by the Top 10 Fortune
500 Technology Companies

Designs
Over 200 New Custom Designs
Developed Per Year
Our Products Benefit the Largest Data Centers in the World.
Receive the latest product information and industry news right in your inbox.
By providing your email address you agree to receive electronic communications from Raritan. You can opt out at any time and we promise we'll never share your information with anyone.