部落格
主頁 » 部落格 » Data Center Airside Economizers and Humidity
Data Center Airside Economizers and Humidity
Posted on December 10, 2013 by Gento
The American Society of Heating, Refrigeration and Air-Conditioning Engineers (ASHRAE) publishes recommended ranges for temperature (65 degrees to 80 degrees F, 18 degrees to 27 degrees C) and relative humidity (20% to 80%).
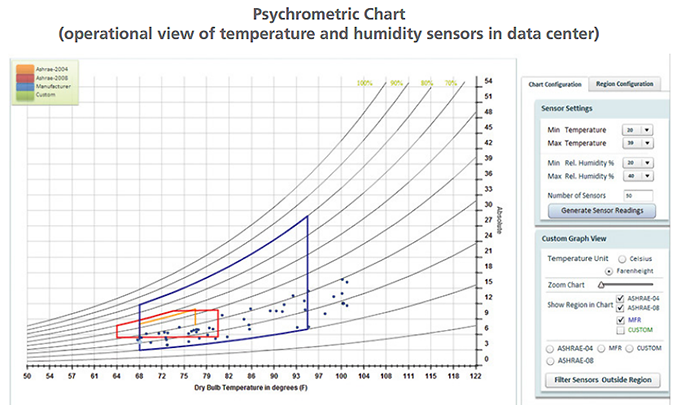
One of the best ways to understand the relationship between temperature and humidity is to look at a psychrometric chart. The bottom of the chart is dry bulb temperature meaning air containing no moisture. The scale on the right of the chart is the amount of moisture in pounds contained in a pound of dry air. The curves running through the chart are the relative humidity (RH) from 0% to 100%. The temperature scale along the 100% RH curve is the wet bulb temperature.
100% RH is the maximum amount of moisture the air can contain. Beyond this point, the dew point (DP), the excess moisture condenses into droplets. The height of the chart increases from left to right. This is because colder air can hold less moisture than warmer air.
If you fill a glass with ice water on a warm summer day, condensation forms on the glass. This is because the air at the surface of the glass has cooled from say 75 degrees F down to just above freezing at the surface of the glass. If the 75 degree F air had a RH of 50% that would be 0.019 pounds of moisture per pound of air. But, at 32 degrees F air saturates (100% RH) at 0.004 pounds of moisture per pound of air. The excess moisture (0.019 – 0.004) becomes the condensation on the glass.
Data centers using airside economizers need to think about adding humidification because the cool outside air, say 40 degrees F and 50% RH with is approximately 0.003 pounds of moisture, comes into the data center and is then warmed by IT equipment to say 80 degrees F. 0.003 pounds of moisture at 80 degrees F is less than 15% RH which is below the ASHRAE recommendation of at least 20% RH to minimize electrostatic discharge (ESD).
Click here to read the Entire Environmental Monitoring White Paper
Other Blog Posts
- 從資料中心失效對企業帶來的骨牌效應──探討感測器的重要性
- Posted on November 5, 2023
- 更高規格的電源要求加速AI市場成長與Raritan PDU的採用
- Posted on October 11, 2023
- 資料中心服務中斷次數減少,但停機的代價仍舊可觀
- Posted on September 20, 2023
- 意見調查:資料中心面臨能源使用與人力短缺困境
- Posted on September 20, 2023
- Raritan安全切換器:相容於Secure NIAP 4.0的桌上型KVM
- Posted on September 20, 2023
訂閱
近期活動
- New Zealand Cloud & Datacenter Convention 2022
- 3 November 2022, 9am – 4pm • Grand Millennium Hotel, Auckland, New Zealand
- Data Centre World Singapore
- 12th – 13th Oct 2022
- Korea Cloud & Datacenter Convention 2022
- 6th Oct 2022
- Philippines Cloud & Datacenter Convention 2022
- 4th Aug 2022
- JANOG50 Meeting Hokkaido
- 3th – 15th July 2022
Raritan最新新聞
- Legrand 使用兩大創新智慧型機架 PDU 重新活化資料中心產業
- Posted on May 1, 2023
- Exclusive interview丨How does Huizhou upgrade its manufacturing industry?
- Posted on December 2, 2021
- Raritan 發表 MasterConsole® 數位雙電腦切換器
- Posted on February 18, 2021
- Legrand Data, Power and Control Division Announced as Finalist in Six Categories at DCS Awards 2020
- Posted on November 9, 2020
- Raritan 新款智慧機櫃控制器 (SRC) 可智慧管理資料中心與關鍵任務設施的環境與安全性資訊
- Posted on November 9, 2020